


- Strongest resistance for Bitcoin sits at $97,828, where 360,470 BTC were accumulated
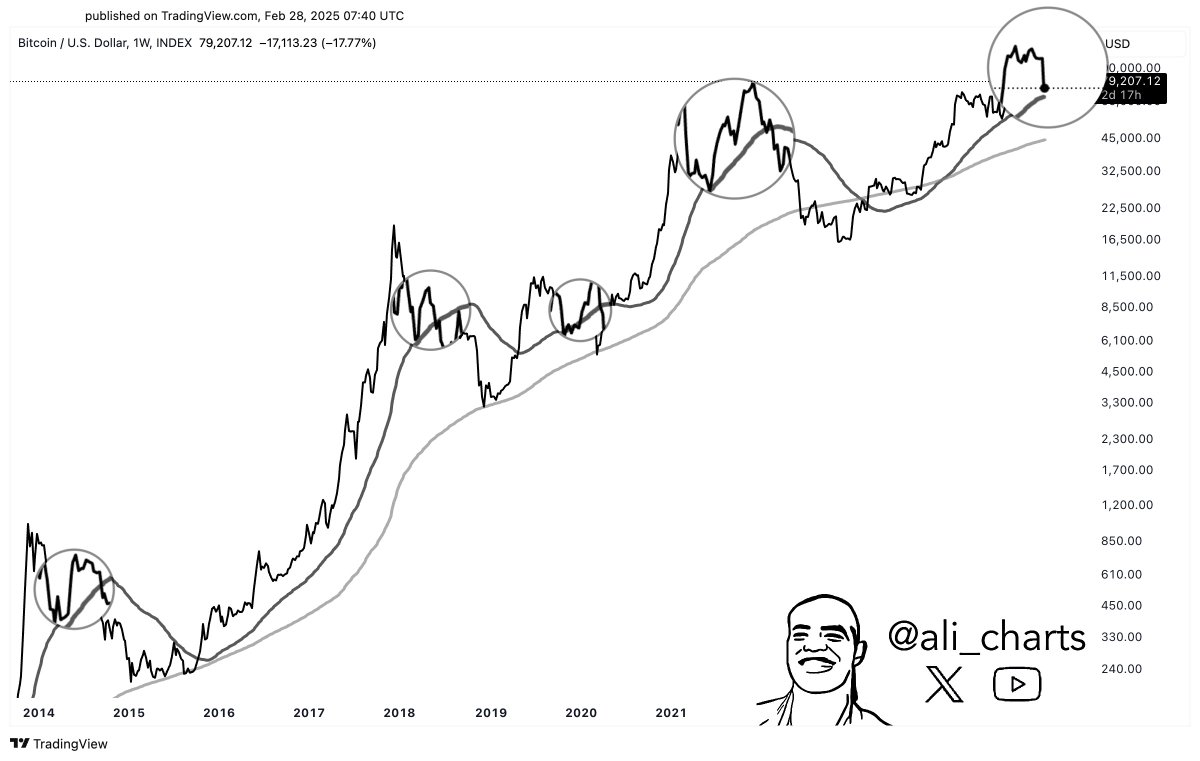
- Bitcoin often bounces off the 50-week moving average, which now stands at $74,700
Bitcoin’s [BTC] cost basis distribution chart highlighted two critical levels – Strong resistance at $97,828 and significant support at $64,078. At the resistance level, about 360,470 BTC were accumulated, making it a major psychological and technical barrier.
Historically, the price struggles to break past such high-density accumulation zones unless there is a surge in demand or a strong catalyst. A bull cycle or surge in ETF inflows can also be huge catalysts for the aforementioned break.
Conversely, the $64,078 support level holds 194,530 BTC, indicating a substantial area where buyers have historically stepped in to prevent further declines.
As per the price structure, Bitcoin rallied from $55,000 in September 2024 to peak above $108,000 in early 2025, showcasing strong momentum along the way.

Source: X
The heavy buying pressure in the $60,000 to just below $75,000 range suggested many investors acquired BTC in this bracket. The crypto’s latest retracement from highs near $100,000 brought BTC back towards the upper bands of this high-support zone.
If Bitcoin fails to reclaim $97k, it risks further corrections towards $75k before retesting the $64k zone. A break below this level would confirm further downside potential, possibly dragging BTC to $55k.
On the contrary, a strong breakout above $97k could trigger a renewed uptrend, targeting new highs above $108k.
Where will BTC strike first?
A further analysis revealed that Bitcoin’s historical trend often finds support at the 50-week moving average, which currently sits at $74.7k. In fact, in each cycle, BTC has previously tested the MA after a strong rally, before continuing its upward trajectory.
For example – Bitcoin approached this moving average in 2015, 2019, and 2021, with each instance leading to a significant price bounce. At the time of writing, BTC had retraced from its recent high near $97,000, all while moving towards the $74,700 support zone. This, despite its recent efforts at recovery.
Source: X
If BTC holds above its current level around $85k, a rebound and possibly a retest of the $90k resistance could follow. However, if the crypto loses this support, a deeper retracement towards $64k is likely – A level where large amounts of BTC were accumulated.
A break below $64k would shift market sentiment bearish, potentially triggering a bigger correction. Conversely, reclaiming $97k and holding it as support would increase the probability of new all-time highs beyond $108k.
With Bitcoin historically bouncing at this key moving average, the next few weeks will be crucial in determining whether it continues its bullish cycle or enters a prolonged correction phase.