


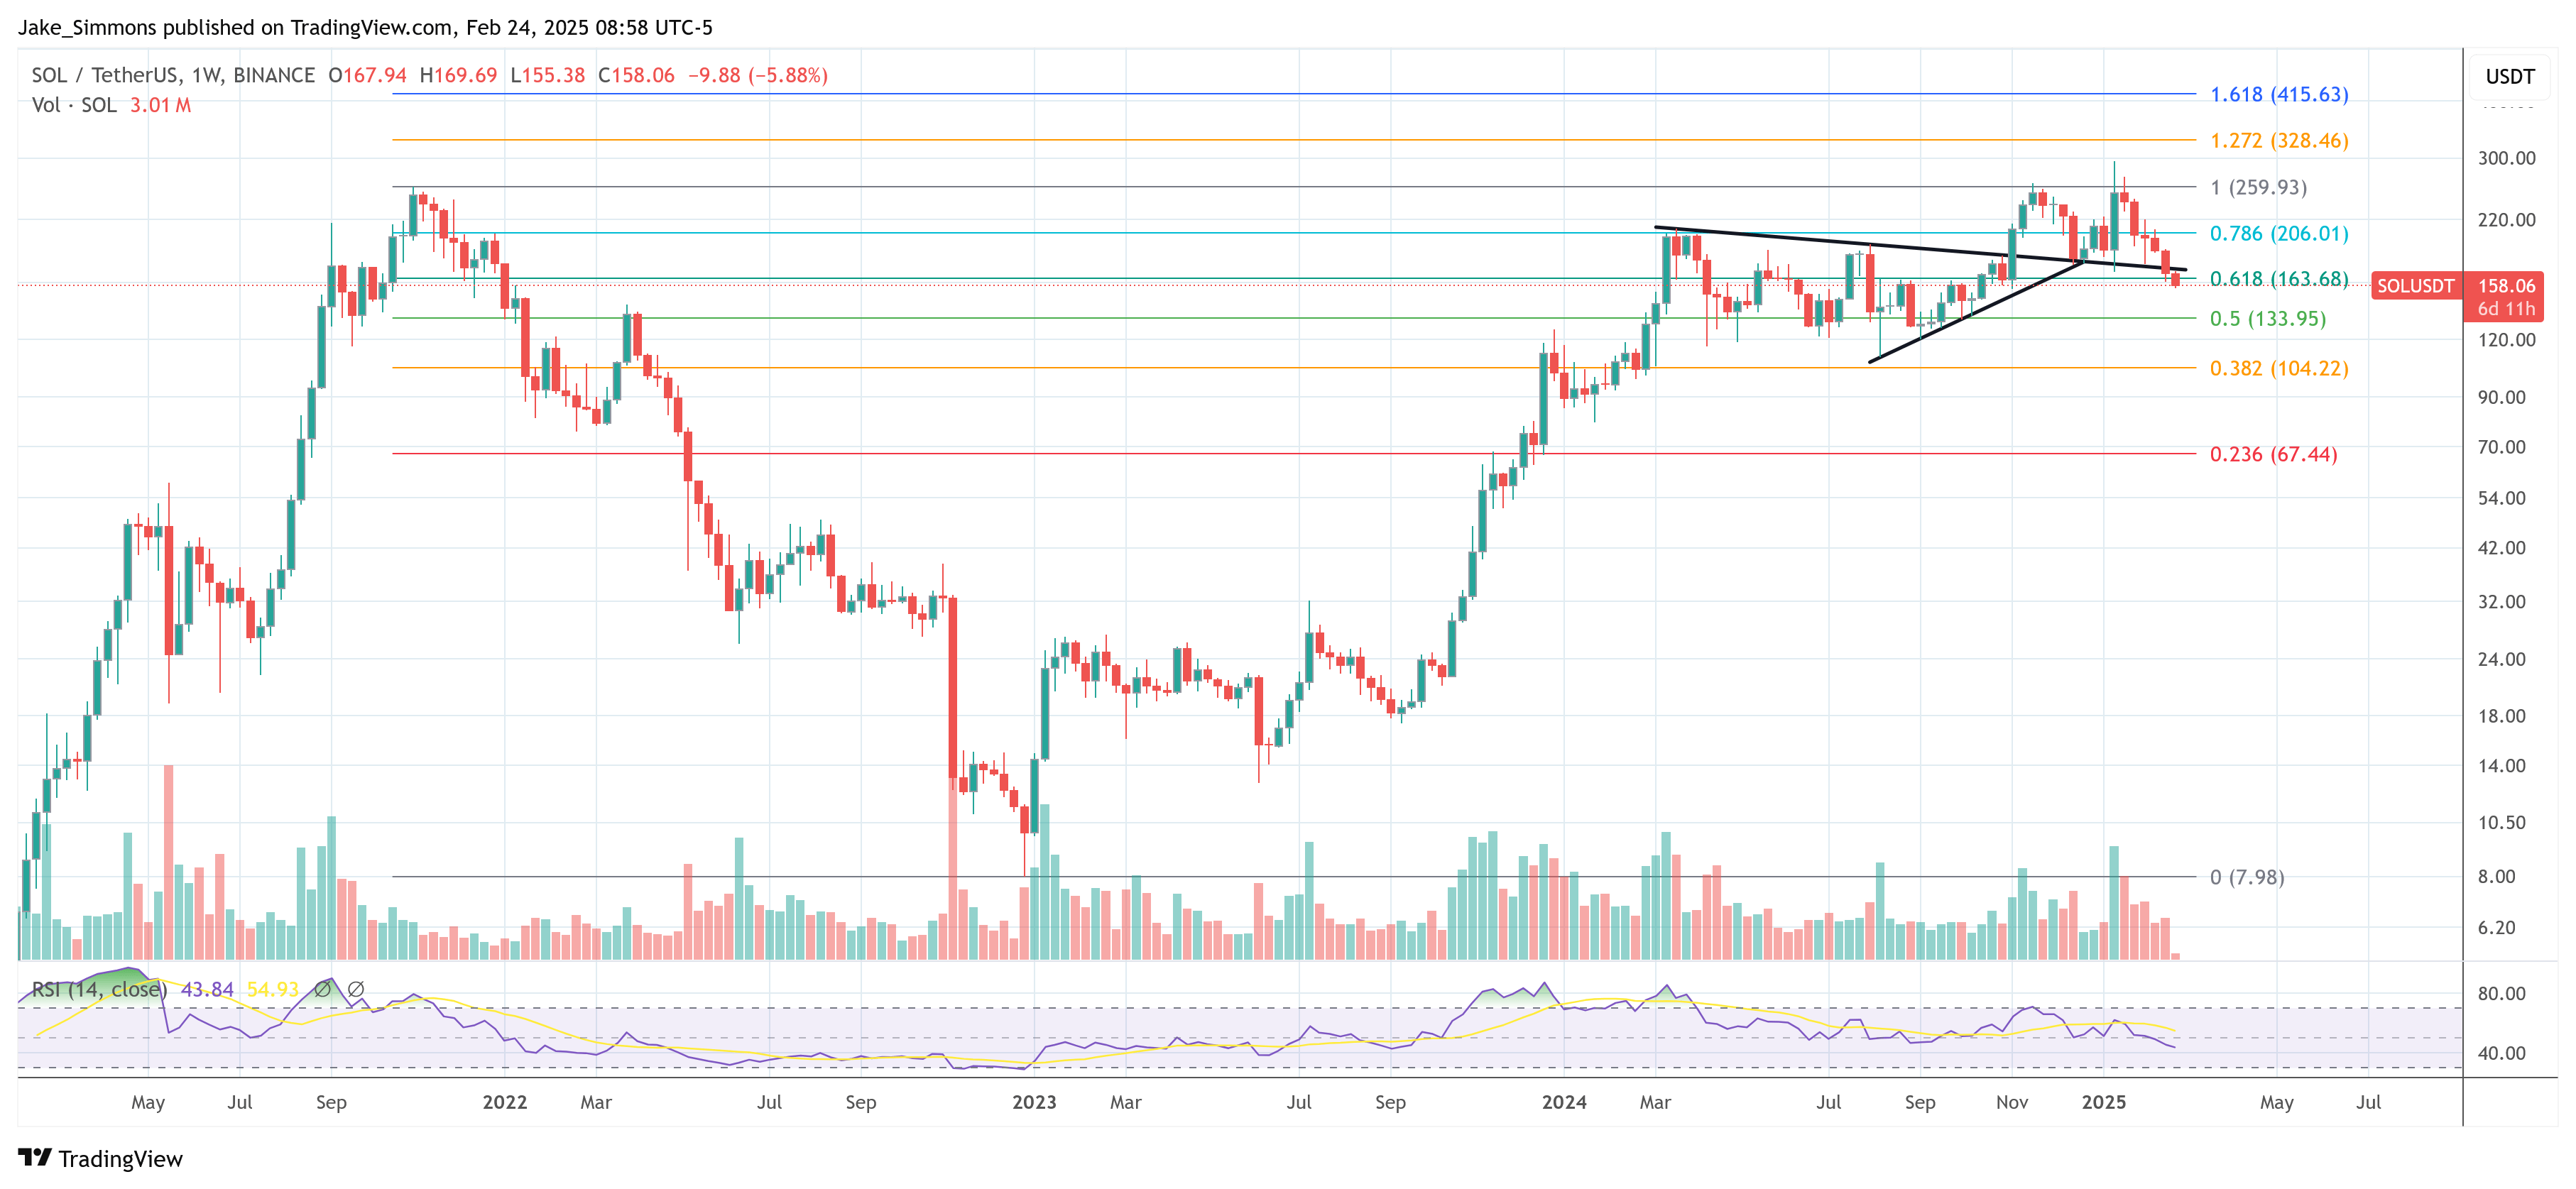
In a technical chart shared today, crypto analyst Koroush Khaneghah, Founder of Zero Complexity Trading, underscores Solana’s ongoing downtrend, highlighting pivotal support and resistance levels on the SOL/USDT Perpetual (Binance) daily timeframe. According to the chart, Solana has lost several key zones and is currently hovering near the $157 area—what Khaneghah labels as the “last major support level.”
The Bearish Argument For Solana
“The downtrend continues as SOL gets rejected by another S/R flip and crashes down to the $150 level. Sentiment at an all-time low. Assume continuation until proven otherwise,” Khaneghah writes via X.
A prominent feature of the analysis is a support/resistance (S/R) flip around $180.58. Earlier in February, Solana attempted to reclaim this level but was met with strong selling pressure. The failure to secure a daily close above $180.58—now acting as resistance—signaled renewed downside momentum.
Following the drop, Solana has settled just above $157, marked on the chart as the “Last major support level.” Prices have briefly dipped below this zone, suggesting fragility in the market’s current stance. A failure to hold $157 on daily closes increases the possibility of further decline toward the next significant horizontal line around $127.05—visible at the lower end of the chart.
Related Reading
Koroush’s annotations also indicate that crossing back above $180.58 would shift the market bias from bearish to “neutral.” Until that happens, the analyst cautions that sellers appear to be in control, with negative sentiment around meme coins reinforcing the ongoing downtrend.
The Bullish Argument For SOL
Meanwhile, crypto analyst RunnerXBT (@RunnerXBT) has shared a orderflow analysis of the Solana (SOL) futures chart (2-hour timeframe on Binance) today. The chart underscores notable price points, liquidations, and changes in positioning ahead of the upcoming March 1 unlock—when 11.2 million SOL (valued at roughly $1.77 billion) are scheduled for release.
In the annotated chart, the price peaked in mid-January, reaching $295, before beginning a steady descent that has most recently seen SOL hovering in the mid-$150 range. The chart shows that from early to late January, there was a significant drop in open interest (OI) alongside a slide in the price, with Cumulative Volume Delta (CVD) suggesting it was driven primarily by long positions closing. RunnerXBT’s notes attribute this to SOL weakness moving largely in tandem (1:1) with Bitcoin.

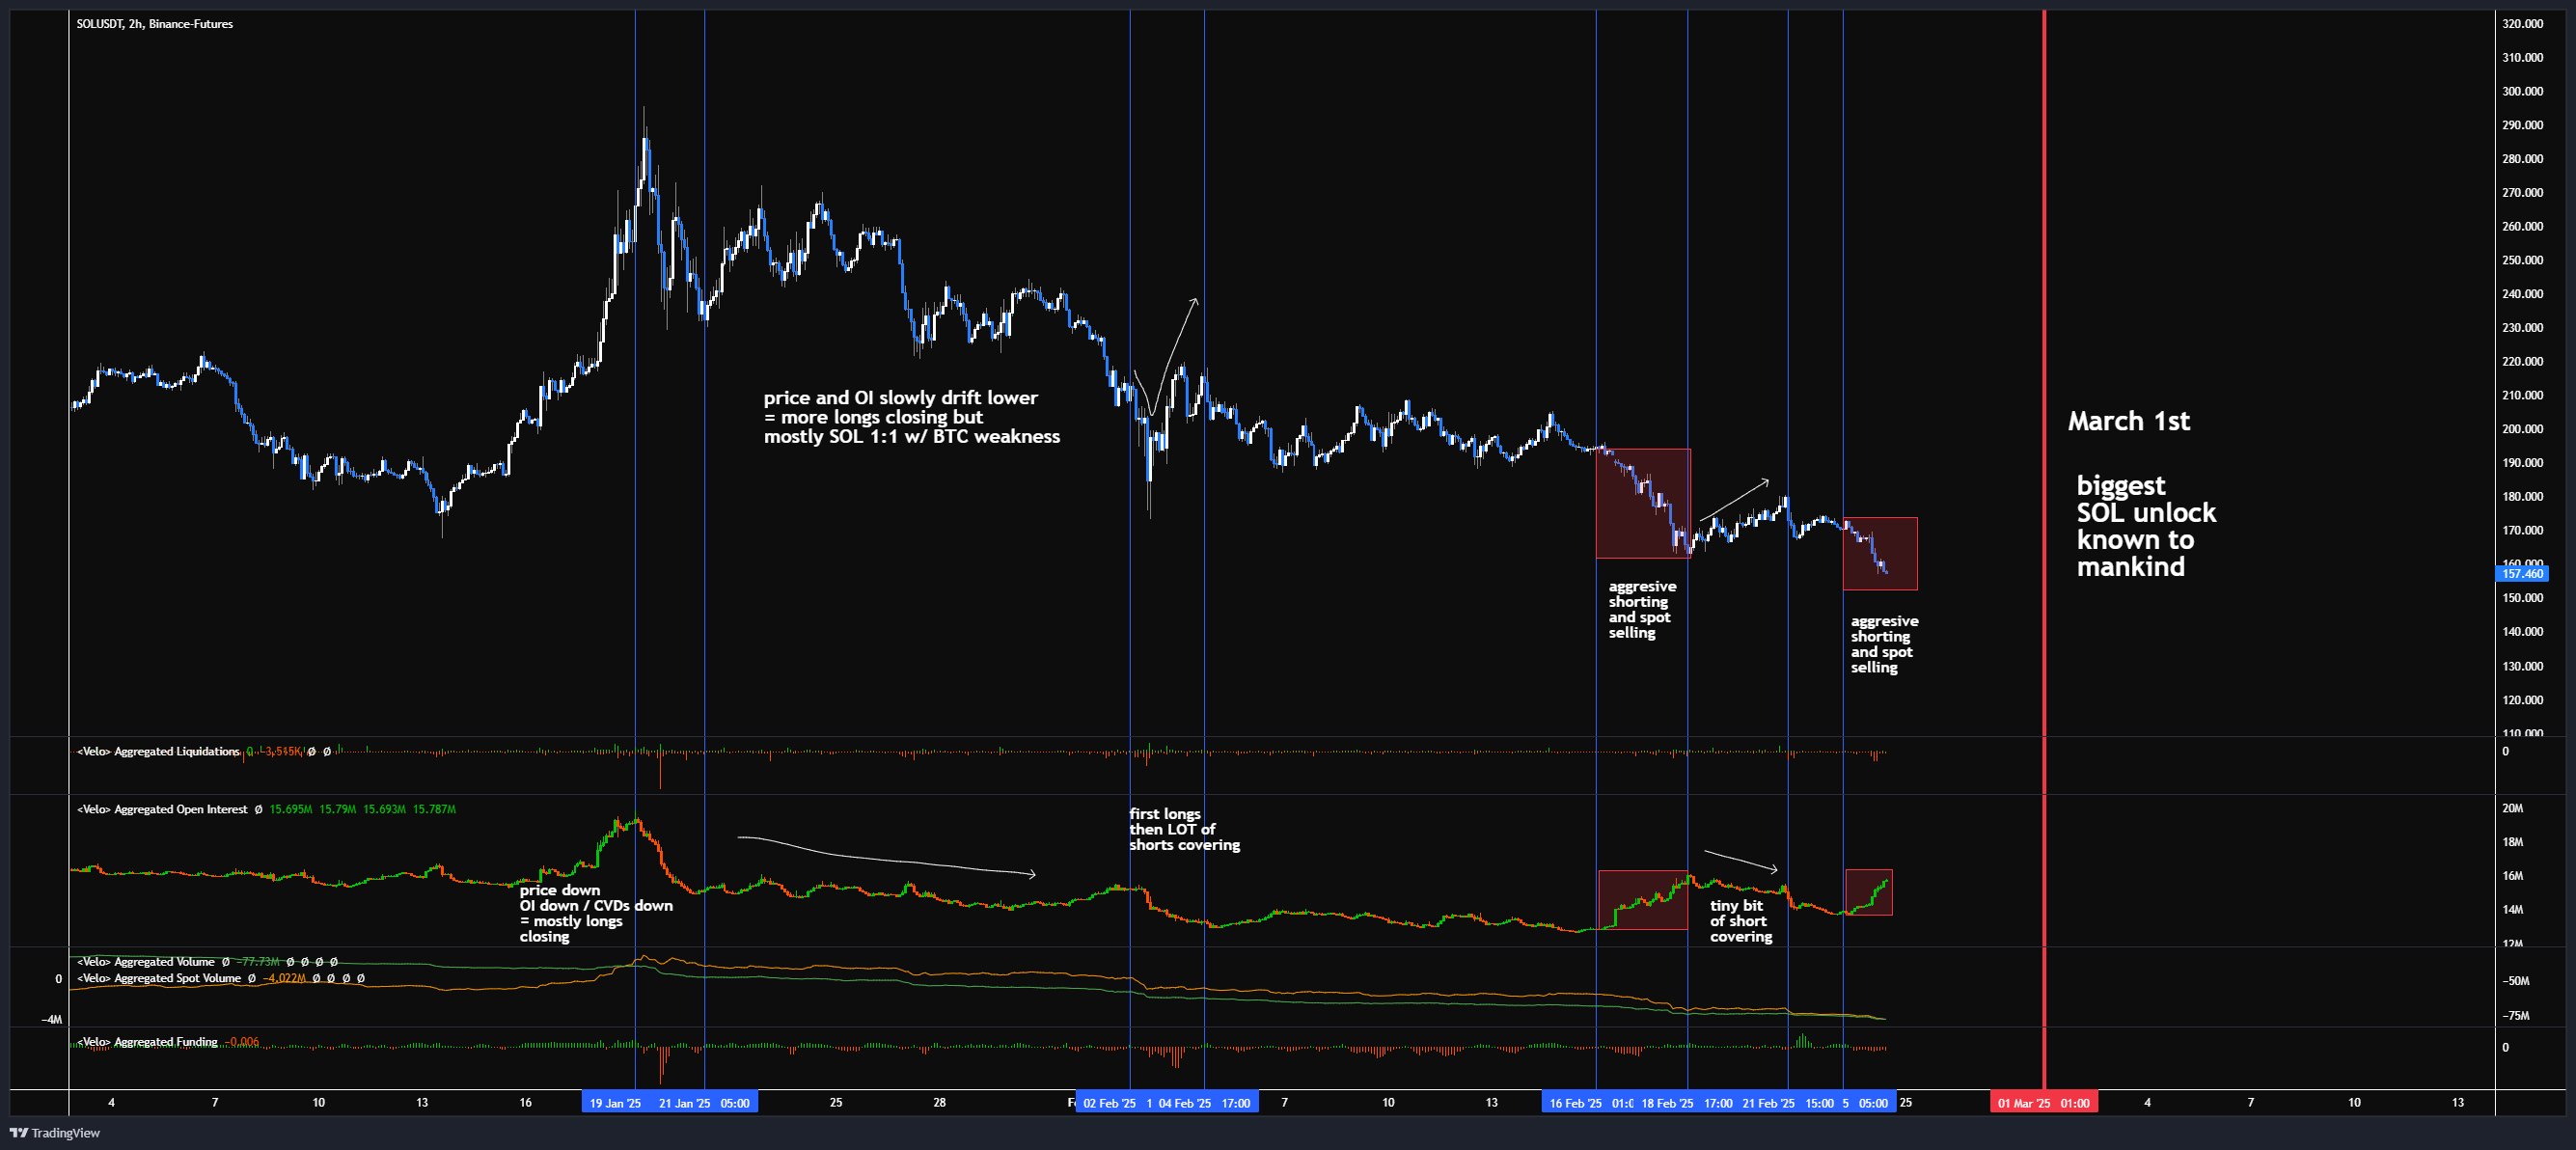
By late January, after a more pronounced downward move, the price and OI both settled at lower levels. OI briefly rebounded in early February, though the chart indicates that initial long positioning was soon followed by short covering as traders pivoted to profit-taking or closed losing short positions. Despite this activity, SOL’s price was unable to mount a sustained uptrend, reinforcing a broader sense of hesitancy among traders.
Related Reading
Around mid-February (February 16–18) and again on February 24, the chart highlights phases of “aggressive shorting and spot selling,” which contributed to persistent downward pressure on the price. Though there were instances of short covering (notably around February 21, where CVD ticked up slightly), the overall momentum has remained subdued, with few signs of new long accumulation.
On the right side of the chart, RunnerXBT has placed a vertical red line marking March 1 as the date of what he calls the “biggest SOL unlock known to mankind.” Many market participants appear to be “front-running” the event by selling in anticipation of a flood of new tokens hitting the market. This has the potential to drive heightened volatility.
Yet, in his post, RunnerXBT warns against shorting SOL at current levels, explaining that he initially started monitoring this situation when the token traded just under $200 and is now seeking a scalp long after the unlock has happened. He points out that attempts to catch every 5–10% daily drop are dangerous and that traders who do so risk frequent stop-outs or liquidations.
“I dont think its a wise “new” short here of SOL. I started posting about the situation at jus under $200 per SOL. I am looking for a scalp long AFTER the unlock, people “frontrunning” it are getting stopped out or liquidated. You aren’t a hero catching -5% to -10% daily falling knives. […] TLDR: Looking for longs (not 5 days before unlock). NOT shorts. if people can’t read, i can’t help you,” he writes via X.
At press time, SOL traded at $158.

Featured image from Shutterstock, chart from TradingView.com