- Positive funding rates have persisted despite consolidation, with rates hitting 0.075% in January 2025
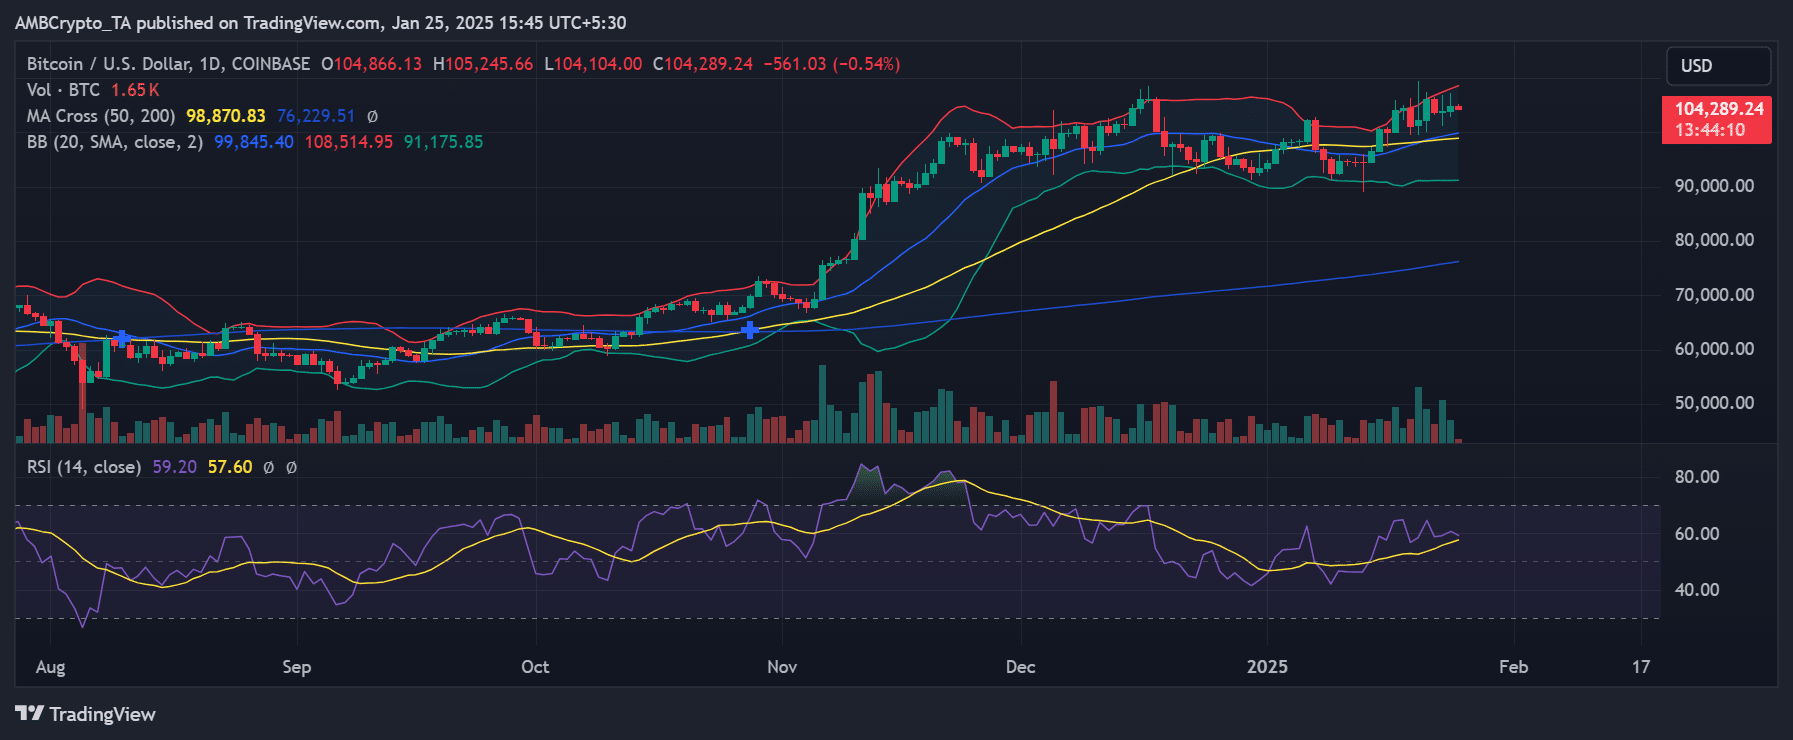
- MA cross between 50-day (98,870.83) and 200-day (76,229.51) averages reinforced the bullish structure
Bitcoin’s [BTC] recent price action around $104,000 gains deeper context when analyzed alongside perpetual futures funding rates. This, because such an analysis reveals crucial insights into market sentiment and potential directional moves.
Bitcoin’s technical landscape and price action
The daily chart suggested that Bitcoin has been consolidating near $104,289, with a slight decline of 0.54% at press time. The MA cross between the 50-day (98,870.83) and 200-day (76,229.51) moving averages maintained a bullish structure for the cryptocurrency.
All while the Bollinger Bands (91,175.85 – 108,514.95) hinted at contained volatility, despite the market’s recent movements.
The RSI’s reading of 59.20 alluded to moderate bullish momentum, without climbing to overbought territory. This seemed to imply that there is still room for upward movement on the charts.
Trading volumes of 1.65k BTC further demonstrated sustained market participation, though not at peak levels.
Funding rate analysis and implications
The perpetual futures funding rate chart revealed significant patterns since May 2024, with January 2025 showing a notable uptick in funding rates across major exchanges. Rates have climbed to 0.075% on some platforms, signaling strengthening bullish sentiment among Futures traders.
This development gained particular significance when viewed against the backdrop of historical funding rate movements since October 2024. The trend showed that the moving average has maintained a predominantly positive trajectory, one coinciding with Bitcoin’s price appreciation.
Examining exchange-specific patterns revealed some very interesting dynamics, particularly during the volatile periods of November and December 2024. During these months, significant divergences emerged between major exchanges, with BitMEX and OKX noting pronounced spikes that hinted at intense leveraged trading activity.
These temporary disconnects between exchanges provided valuable insights into market participant behavior during periods of heightened activity.
Market implications for Bitcoin and trading dynamics
The correlation between funding rates and price action offers a comprehensive view of market sentiment. The prevailing environment, characterized by sustained positive funding despite price consolidation, seemed to hint at a sophisticated accumulation phase – One where traders maintain long positions regardless of short-term price stagnation. Such a divergence between steady prices and positive funding highlighted the building pressure for a potential directional move, supported by the technical indicators.
However, a sustained positive funding rate environment also presents some inherent risks. The significant presence of leveraged positions, highlighted by elevated funding rates, fuels vulnerability to potential long squeezes if the price fails to break higher.
This dynamic requires careful monitoring of Bitcoin’s key support levels, particularly around the 50-day moving average at $98,870.
– Read Bitcoin (BTC) Price Prediction 2025-26
The combination of technical indicators and funding rate patterns means this is a critical juncture for Bitcoin, one that could see the crypto register some upside.
This outlook remains valid as long as the market structure maintains integrity above its crucial support levels, with particular attention to volume patterns and funding rate trajectories across major exchanges.
