Key Notes
- Riot offloaded $38.8 million in BTC amid miner squeeze.
- Ali Martinez flags a 3-day chart sell signal, hinting at a possible correction.
- Coinbase Premium Gap turns negative, reflecting bearish US sentiment.
Bitcoin miner Riot Platforms offloaded $38.8 million worth of BTC
BTC
$96 611
24h volatility:
2.1%
Market cap:
$1.92 T
Vol. 24h:
$29.09 B
in April, joining a growing number of miners liquidating holdings. While the firm’s deployed hash rate held steady, its Bitcoin production declined by 13% from March.
This highlights how block reward cuts from the April 2024 halving are affecting miners’ operational efficiency. The sell-off comes as the broader mining landscape is under pressure.
Notably, April 7 witnessed the third-largest miner selloff of 2025, with 15,000 BTC sent to exchanges in a single day, per CryptoQuant.
Meanwhile, analyst Ali Martinez recently flagged a sell signal for Bitcoin on the 3-day chart, further fueling caution in the market.
#Bitcoin $BTC flashes a sell signal! pic.twitter.com/97hj7iObdQ
— Ali (@ali_charts) May 4, 2025
The Coinbase Premium Gap confirms the selling pressure, turning negative once again, currently at -5.07. This suggests US investors are increasingly selling BTC on Coinbase, dragging the price lower compared to other global platforms.
Coinbase premium gap | Source: CryptoQuant
If the Coinbase Premium remains in negative territory, short-term downside risk could escalate, especially amid growing miner outflows.
BTC Price Outlook
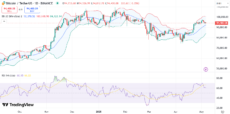
At the time of writing, Bitcoin is consolidating around $94,400 after a brief rally to $97,600 last week. On the daily BTC price chart, the RSI stands at 60, suggesting the largest cryptocurrency remains in bullish territory but is losing momentum.
A further drop in RSI could shift the sentiment to bearish. Immediate support lies near, while. A decisive break below $92,000 support could send BTC further downwards in the short-term.

BTC price chart with Bollinger bands and RSI | Source: TradingView
Bollinger Bands are tightening slightly after a recent expansion, with the price approaching the upper band. The cryptocurrency could face resistance around $96,800 and traders could see a pullback toward the middle band (20-day SMA) near $92,370.
BTC price chart with MACD | Source: TradingView
Meanwhile, the MACD histogram is beginning to fade, with a possible bearish crossover in the near term.
Disclaimer: Coinspeaker is committed to providing unbiased and transparent reporting. This article aims to deliver accurate and timely information but should not be taken as financial or investment advice. Since market conditions can change rapidly, we encourage you to verify information on your own and consult with a professional before making any decisions based on this content.
A crypto journalist with over 5 years of experience in the industry, Parth has worked with major media outlets in the crypto and finance world, gathering experience and expertise in the space after surviving bear and bull markets over the years. Parth is also an author of 4 self-published books.