Bitcoin crossed the $100,000 milestone on Wednesday, hitting a new all-time high at $104,088 on December 5. Crypto traders’ enthusiasm was rewarded with significant capital inflows to Spot Bitcoin ETFs and increase in BTC options trade volume.
Post Bitcoin’s rally to $100,000 (BTC), traders are looking for the next altcoin to shift their focus to, expecting higher returns as the cycle progresses. Capital rotation is likely while altcoin season is in play, and altcoins like Ethereum (ETH), Render (RNDR), Sui (SUI), Pepe (PEPE), Hyperliquid (HYPE) and Ondo (ONDO).
Bitcoin cycle top and where BTC is headed after $104,000
Bitcoin Pi cycle top indicator predicts a break past $125,494 before BTC tops this market cycle. Bitcoin is 22% below the target, and dominance has climbed nearly 2% within two days.
Rising Bitcoin dominance signals that there is more upside potential, and BTC could extend its gains. Interestingly, the altcoin season is in full swing, with 75% of the top 100 altcoins outperforming BTC in a 90-day time period.
BTC is headed towards a multiple of the 350-day moving average on the Pi cycle top indicator, and rising dominance supports a bullish thesis for the largest cryptocurrency.
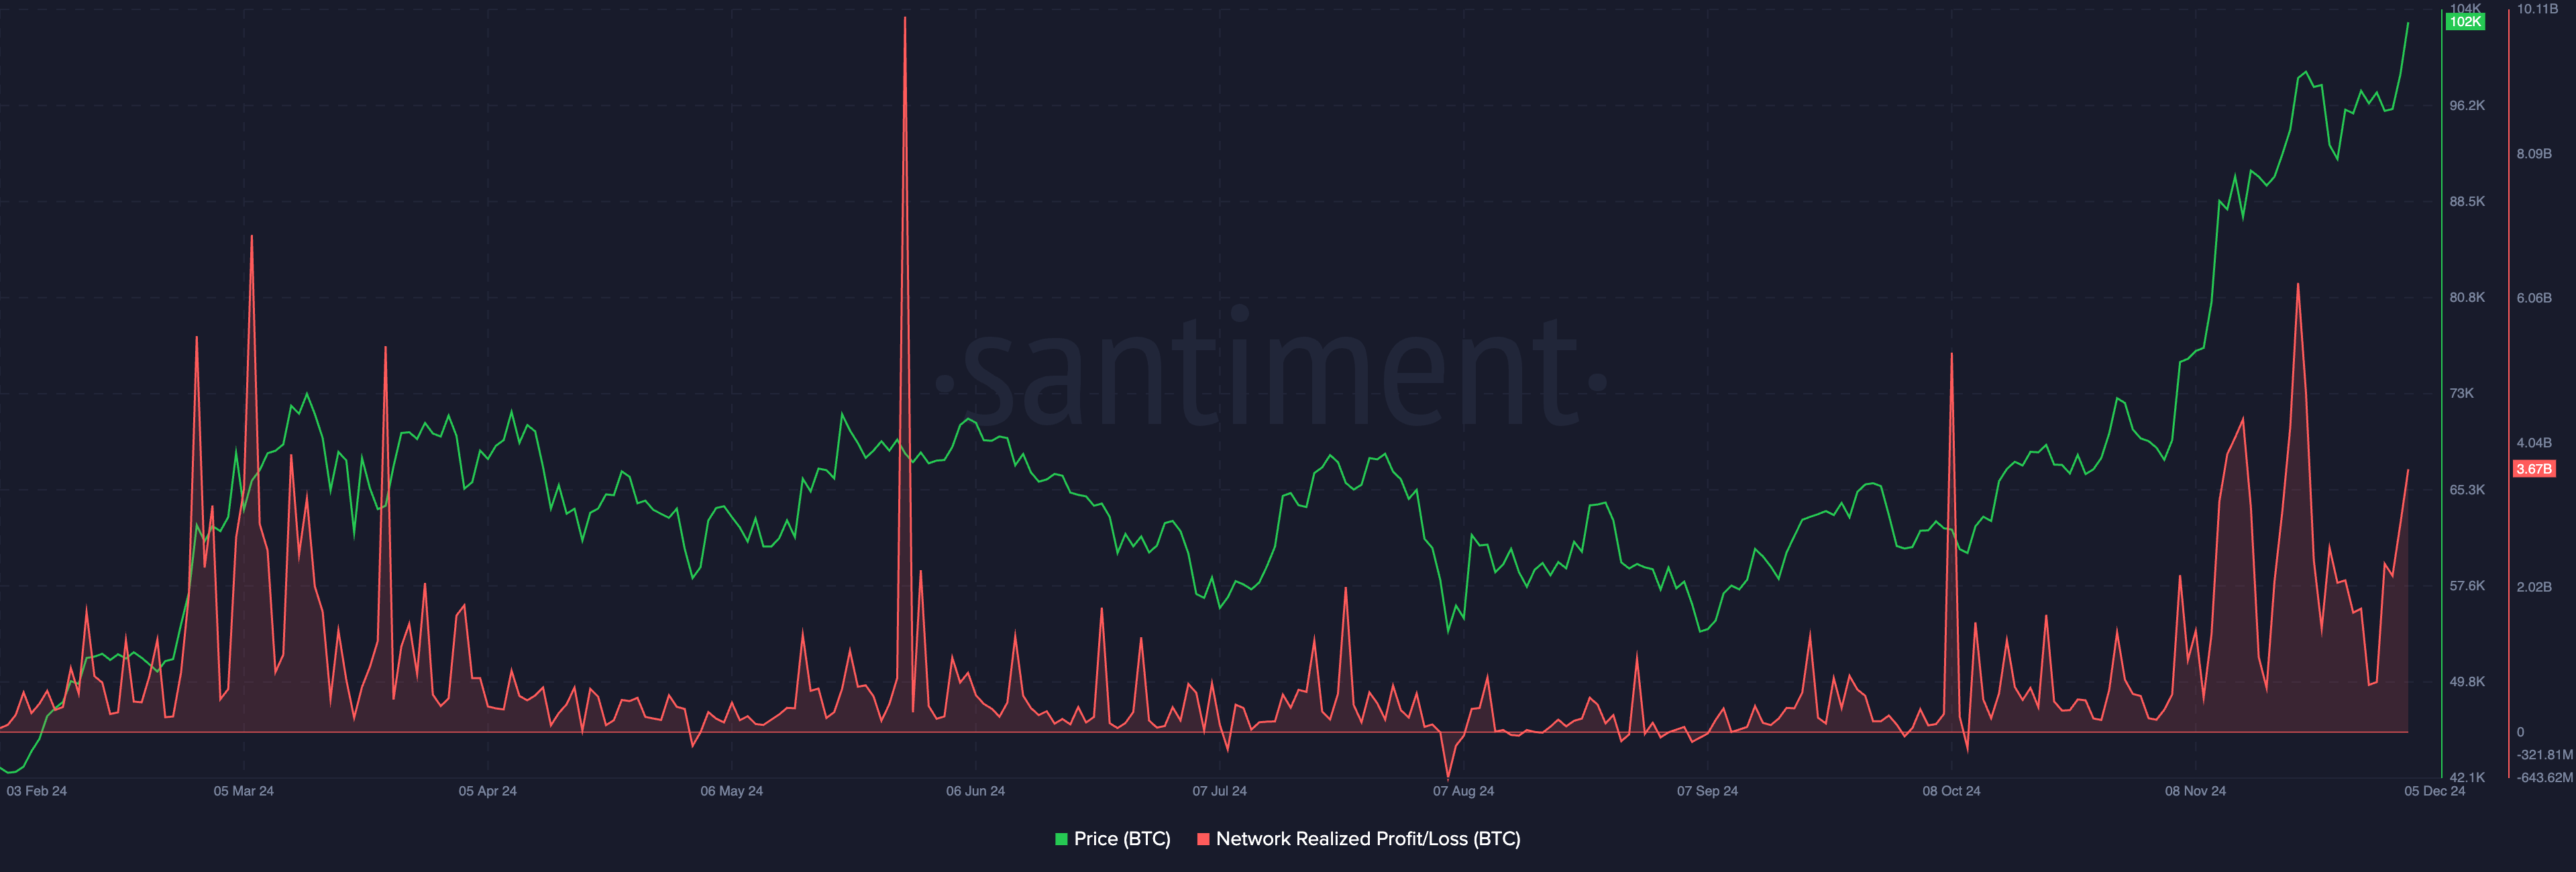
Network realized profit/loss metric on Santiment shows that traders are consistently taking profit on their Bitcoin holdings. Several large spikes were observed between October 8 and December 5, however it is relatively low when compared to the spike noted in May 2024 when BTC price hovered around the $70,000 level.
Larger and more concentrated spikes in the NPL metrics could indicate the likelihood of a correction in BTC from the increase in selling pressure across crypto exchanges.

Altcoins to watch this week
Blockchain.centre’s altcoin season index suggests alts could continue outperforming BTC, as they did in the past 90 days. The index helps identify whether the altcoins in the top 100 cryptocurrencies ranked by market cap are yielding gains or lagging behind when compared to Bitcoin.
While most altcoins in the top 50 rally alongside Bitcoin this week, the top five tokens to watch are Render, Sui, Pepe, Hyperliquid and Ondo.
Render rallied close to its March 2024 peak at $11.7613. A 35% rally from the current price could push RNDR to test resistance at $13.6330. Technical indicators, relative strength index and moving average convergence/ divergence support the thesis of price gain in RNDR.
The 161.80% Fibonacci retracement of RNDR’s rally sets $16.9517 as the cycle top and price discovery target this cycle.
SUI is nearly 20% away from its psychologically important $5 target. Sui token trades at $4.1588 on December 5, rallying alongside Bitcoin.
RSI has crossed above 70, typically this would generate a sell-signal for traders however MACD could see a crossover of the MACD line above the signal line, a bullish sign for SUI.
PEPE is gearing to test its November 2024 peak of $0.00002597, nearly 17% above the current price level.
RSI is sloping upwards and under the 70 level, meaning PEPE is not in the overvalued zone yet. PEPE could enter price discovery once it breaks past its November peak, the $0.00003348 is the price discovery target for PEPE.
The target coincides with the 141.40% Fibonacci retracement of the November price rally.
HYPE hit a new all-time high at $0.12875 on Thursday. The token could rally to the psychologically important $0.15000 level, nearly 22% above the current price.
A successful break of this level could bring the $0.17689 target into play, this represents the 141.40% Fibonacci retracement of HYPE’s rally to its new all-time high.
Technical indicators support a thesis of gain in HYPE price.
ONDO trades at $1.74214 at the time of writing. The token is 12% away from its all-time high of $1.95063.
RSI is sloping upward and shows that ONDO is currently overvalued at 86. While typically it is considered a sell signal for the token, MACD flashes green histogram bars above the neutral line, signaling underlying positive momentum in ONDO price.
Ethereum gears for gains
Ethereum is on an upward trend. The altcoin could target its previous all-time high at $4,878 if the altcoin sustains its upward momentum.
ETH price needs to break above the psychologically important $4,000 level to target the previous all-time high and enter price discovery this cycle. With upcoming ecosystem developments and higher utility and adoption with layer 2 and layer 3 chains, Ethereum gears for further gains.
The RSI is sloping upwards, crossing above 70. MACD signals underlying positive momentum in Ethereum price trend on the daily timeframe.
Strategic considerations
As Bitcoin dominance resumes its upward climb and XRP attempts to dethrone USD Tether (USDT) as the third largest cryptocurrency, traders are rotating capital to altcoins, XRP and Solana (SOL) based meme coins and artificial intelligence tokens.
Over $135 million in shorts were liquidated in the past 24 hours per Coinglass data, Bitcoin’s rally to $104,000 has added nearly 12% in open interest and 125% in options trading volume.
Traders are consistently taking profits in Bitcoin, and this supports the capital rotation thesis.
Ki Young Ju of CryptoQuant argues this cycle is different from previous ones. Institutional investors buying Bitcoin have no interest in rotating into altcoins, and this implies that altcoin price rallies rely on an influx of capital from retail traders across crypto exchange platforms.
Traders need to watch exchange user activity and the altcoin market capitalization chart to determine the top cycle for altcoins this season.
The total crypto market capitalization, excluding Bitcoin, is still 8.5% below its 2021 cycle top of $1.71 trillion. As retail traders inject capital into crypto exchanges, the market cap is expected to climb past $1.57 trillion.
The chart is key for traders looking to rotate into altcoins while Bitcoin holds steady above $100,000.
Disclosure: This article does not represent investment advice. The content and materials featured on this page are for educational purposes only.

