

Reason to trust
Strict editorial policy that focuses on accuracy, relevance, and impartiality
Created by industry experts and meticulously reviewed
The highest standards in reporting and publishing
Strict editorial policy that focuses on accuracy, relevance, and impartiality
Morbi pretium leo et nisl aliquam mollis. Quisque arcu lorem, ultricies quis pellentesque nec, ullamcorper eu odio.
XRP’s price action in the past seven days has been nothing short of impressive. The cryptocurrency reached above $2.6 again in the past 24 hours, the first time doing so since early March, about two months ago. This movement has aligned with the uptrend projected by multiple analysts, who are referencing Fibonacci levels to chart XRP’s future trajectory.
Notably, a crypto analyst’s interesting outlook on social media platform X using Fibonacci levels suggests that XRP will reach $8.40 and $27 this cycle.
Analyst Points To Fibonacci Targets At $8.40 and $27
XRP’s price structure in the current cycle has been significantly shaped by its breakout above a tightening wedge formation, which had compressed price action from 2021 through the early months of 2024. This formation, clearly visible on the monthly candlestick timeframe, served as a multi-year consolidation zone that capped upward momentum and defined a range-bound market.
Related Reading
The eventual breakout from this structure ended a prolonged bear market and began a fresh bullish phase. Although the past few months have been full of corrections and consolidations after XRP reached $3.31 in January, recent market momentum points to the next leg upward.
A crypto analyst on social media platform X has pointed to two Fibonacci extension levels that could serve as the target zones during XRP’s next impulsive wave up. According to the analysis, XRP reached both its 1.272 and 1.618 Fibonacci extension targets in the last cycle after breaking from a similar multi-year wedge accumulation structure in 2017.
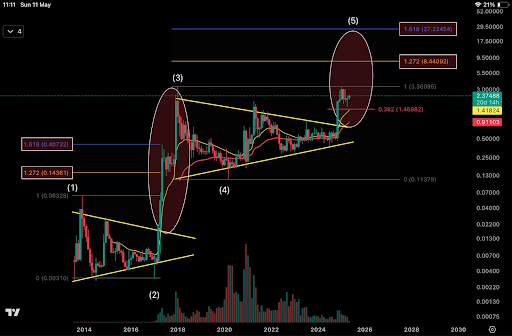
Interestingly, this move in 2017, leading up to the current price action, is part of the same Elliott wave count structure. As shown in the chart, XRP launched from a low of $0.00310 in 2017 to an all-time high of $3.40 in 2018 during its third wave (labeled (3)), hitting both Fibonacci extension levels of 1.272 and 1.618 before retracing in wave four.
According to the analyst, the current price action since 2020 constitutes the formation of the fifth impulse wave. Applying the same extension logic to the current structure from the 2020 low of $0.11379, a move to these Fibonacci extensions points to a target of $8.40 at 1.272 and $27.23 at the 1.618 extension.
XRP To Reach $8.40 Or Even $27 This Market Cycle?
Whether XRP can realistically surge to $8.40 or even $27 during this market cycle is yet to be seen. Although the 2017 to 2018 rally where XRP climbed over 1,000% in a matter of weeks offers a compelling case, market conditions today are more complex. The amount of inflows and trading volume needed to push the XRP price to such levels would be far greater than those witnessed before.
Related Reading
However, from a technical perspective, these Fibonacci targets can be reached when considering how similar price structures have behaved in the past. An example is the rally from $0.00310 to over $3.40 in 2017. One similar analysis from crypto analyst Ali Martinez suggests that the XRP price could reach $15 very soon.
At the time of writing, XRP is trading at $2.50, up by 3.4% in the past 24 hours with an intraday high of $2.61.

Featured image from Getty Images, chart from Tradingview.com