

Key takeaways:
- Cosmos’s price is predicted to reach a maximum value of $6.80 in 2025.
- In 2028, the coin could be worth between $18.49 and $21.97, with an average price of $19.01.
- By 2031, Cosmos (ATOM) might touch $67.56.
Cosmos (ATOM) is a blockchain ecosystem that facilitates interoperability among independent blockchains. Co-founded by Jae Kwon and Ethan Buchman in 2014, Cosmos aims to create a decentralized network of blockchains that can communicate and transact seamlessly. Its main components include the Cosmos Hub, which serves as the central chain, and multiple “zones” that operate under their own rules while connecting to the Hub.
The platform uses the Tendermint consensus algorithm and Inter-Blockchain Communication (IBC) protocol to enable fast low-cost transactions. Fees average around $0.01, and confirmation times are approximately seven seconds. Cosmos employs a Proof-of-Stake (PoS) mechanism, allowing users to stake their ATOM tokens for network security and transaction validation.
Since its ICO in 2017, Cosmos has raised significant funding and established a growing ecosystem, including notable projects like Terra and Binance. With over 286 million ATOM tokens in circulation and a market cap exceeding $7.7 billion, Cosmos is positioned as a key player in the evolving landscape of blockchain technology, often referred to as the “Internet of Blockchains” for its ambitious goal of connecting diverse blockchain networks.
Overview
| Cryptocurrency | Cosmos |
| Token | ATOM |
| Current Price | $3.97 |
| Market Cap | $1.55B |
| Trading Volume | $121.88M |
| Circulating Supply | 390.93M ATOM |
| All-time High | $ 44.70 on Sept 19, 2021 |
| All-time Low | $1.13 on Mar 12, 2020 |
| 24-hour High | $4.00 |
| 24-hour Low | $3.80 |
Cosmos price prediction: Technical analysis
| Metric | Value |
| Volatility (30-day variation) | 8.26% |
| 50-Day SMA | $4.94 |
| 14-Day RSI | 38.93 |
| Sentiment | Bearish |
| Fear & Greed Index | 27 ( Fear) |
| Green Days | 12/30 (40%) |
| 200-Day SMA | $5.95 |
Cosmos (ATOM) technical price analysis
TL; DR Breakdown:
- ATOM remains in a broader downtrend with resistance at $4.26 and support near $3.95 while low volatility suggests a potential breakout
- RSI is near oversold territory which could indicate a short-term recovery while the 4-hour chart shows consolidation with slight bullish divergence
- If ATOM holds above $4.00 it may push toward $4.26 but failure to sustain could lead to further downside toward the $3.60 range
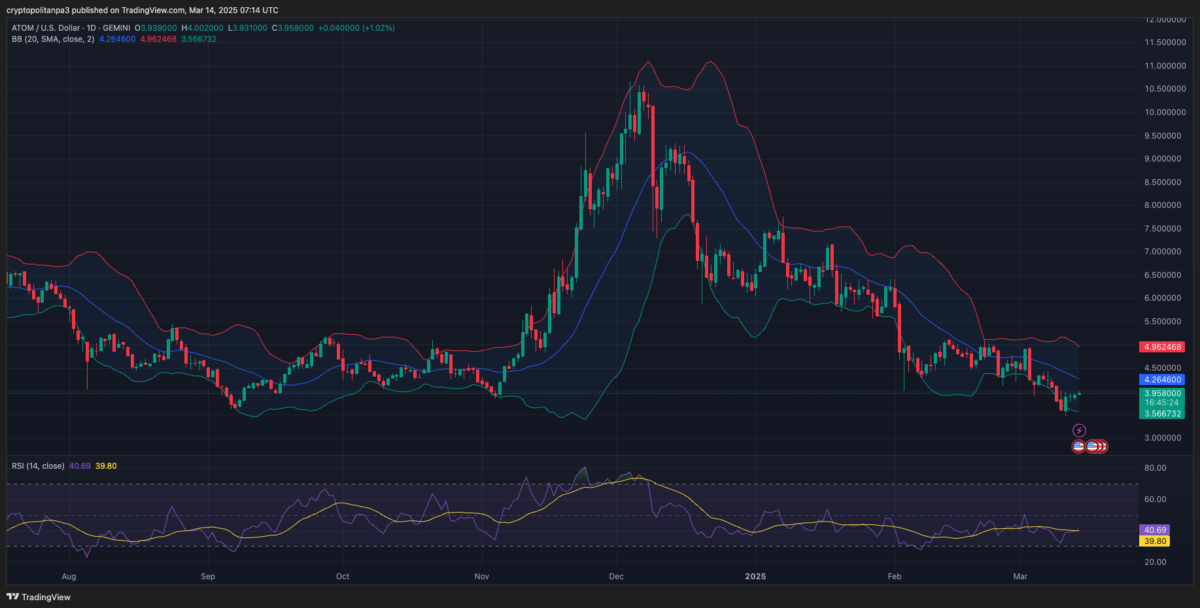
ATOM/USD 1-Day price chart
Based on the 1-day chart for ATOM on March 14, the price is currently in a downtrend but showing early signs of recovery. Bollinger Bands indicate that volatility is slightly expanding, suggesting the potential for price movement in either direction. The RSI is at 39.80, nearing the oversold region, which could indicate a possible buying opportunity if momentum shifts.
ATOM’s price is attempting to rebound from a local support level near $3.95, with resistance around $4.26. If the bullish momentum continues, a push towards $4.50 is possible. However, failure to sustain buying pressure could lead to another dip toward $3.56.
ATOM/USD 4-hour price chart

Based on the 4-hour chart for ATOM, the price is consolidating near the $3.95 support level, with minor bullish attempts to break resistance at $4.05. Bollinger Bands indicate low volatility, suggesting a potential breakout if momentum strengthens. The MACD is slightly positive but lacks strong bullish confirmation, meaning further upside movement requires increased buying pressure.
The Balance of Power remains weak, indicating a struggle between bulls and bears. If ATOM sustains above $4.00, a short-term rally towards $4.26 is possible. However, a breakdown below $3.83 could lead to further declines toward $3.60, continuing the overall bearish trend.
Cosmos technical indicators: Levels and action
Daily simple moving average (SMA)
| Period | Value | Action |
| SMA 3 | $ 4.89 | SELL |
| SMA 5 | $ 4.42 | SELL |
| SMA 10 | $ 4.48 | SELL |
| SMA 21 | $ 4.49 | SELL |
| SMA 50 | $4.94 | SELL |
| SMA 100 | $ 6.06 | SELL |
| SMA 200 | $5.95 | SELL |
Daily exponential moving average (EMA)
| Period | Value | Action |
| EMA 3 | $4.47 | SELL |
| EMA 5 | $4.81 | SELL |
| EMA 10 | $5.40 | SELL |
| EMA 21 | $ 6.05 | SELL |
| EMA 50 | $ 6.60 | SELL |
| EMA 100 | $ 6.50 | SELL |
| EMA 200 | $ 6.53 | SELL |
What to expect from ATOM price analysis next?
ATOM’s price action on both the 4-hour and 1-day charts indicates a cautious market with weak bullish momentum. On the 1-day chart, ATOM remains in a broader downtrend, with resistance at $4.26 and support near $3.95. Bollinger Bands suggest low volatility, signaling a potential breakout if volume increases.
The RSI hovers near oversold territory, hinting at a possible short-term recovery. On the 4-hour chart, ATOM is consolidating, with MACD showing slight bullish divergence. If the price holds above $4.00, a push toward $4.26 is likely. However, failure to sustain could lead to further downside towards the $3.60 range.
Is Cosmos a good investment?
Cosmos (ATOM) shows potential as an investment due to its innovative approach to blockchain interoperability and recent upgrades like ATOM 2.0. Analysts predict long-term price growth, but the crypto market is highly volatile. Investors should conduct their research and consider risks before investing in ATOM.
Is Cosmos a Safe Network?
The Cosmos network is built on the Tendermint consensus protocol, offering robust security and interoperability features. However, like all blockchain systems, it faces potential risks, requiring users to remain cautious and well-informed about emerging vulnerabilities and challenges.
Will Cosmos reach $50?
Based on Cosmo’s current market trends and growth projections, Cosmos (ATOM) is expected to reach a value of approximately $45.96 by 2030.
Will Cosmos reach $100?
Current predictions suggest that Cosmos (ATOM) will unlikely reach $100 soon. Analysts estimate it would require a significant increase of over 900% to hit that price. Our forecasts place its maximum potential around $67.56 by 2031, indicating limited short-term growth potential.
Does Cosmos have a good long-term future?
Cosmos (ATOM) promises a strong long-term future, with forecasts indicating significant price increases over the next decade. Analysts predict that ATOM could reach values as high as $45.96 by 2030, driven by its unique position in the blockchain ecosystem and ongoing developments in interoperability and scalability. The Cosmos Hub is well-established and supported by a dedicated community, enhancing its growth and adoption prospects in the evolving cryptocurrency landscape. Thus, the cosmos network could expand to a wider user base.
Recent news/opinion on Cosmos
Cosmos announced that Shade Protocol has launched ShadeX, the first encrypted money market, allowing users to earn passive yields while maintaining privacy. Unlike traditional crypto markets that expose financial details, ShadeX secures transactions with encryption. Built on CosmosSDK and CosmWasm, it aims to bring institutional-grade privacy to on-chain finance.
The Cosmos ecosystem kicks off 2025 with a significant achievement: 100 Cosmos chains are now live on @MapOfZones. This milestone, a snapshot of the thriving ecosystem, has been permanently inscribed using @asteroidxyz.
Looking ahead, Cosmos plans to track the ecosystem’s growth annually and preserve these milestones on the Hub, ensuring the network’s evolution is documented for posterity.
Cosmos Price Prediction March 2025
In March 2025, Cosmos (ATOM) could reach a maximum price of $4.75, with an average trading price of $4.61 and a minimum price of $4.18
| Month | Potential Low | Potential Average | Potential High |
| March 2025 | $4.18 | $4.61 | $4.75 |
Cosmos Price Prediction 2025
In 2025, Cosmos (ATOM) is projected to have a potential low of $6.08, an average price of $6.26, and a potential high reaching up to $6.80.
| Year | Potential Low | Average Price | Potential High |
| 2025 | $6.08 | $6.26 | $6.80 |
Cosmos price predictions 2026-2031
| Year | Potential Low ($) | Average Price ($) | Potential High ($) |
| 2026 | $8.78 | $9.09 | $10.39 |
| 2027 | $12.59 | $12.96 | $15.65 |
| 2028 | $18.49 | $19.01 | $21.97 |
| 2029 | $26.32 | $27.08 | $33.07 |
| 2030 | $38.00 | $39.35 | $45.96 |
| 2031 | $56.72 | $58.29 | $67.56 |
Cosmos Price Prediction 2026
In 2026, ATOM’s average price is expected to be $9.09. Its minimum and maximum trading prices are predicted to be $8.78 and $10.39, respectively.
Cosmos Price Prediction 2027
In 2027, Cosmos may continue its upward trend, with projections suggesting a maximum of $15.65, an average of $12.96, and a minimum of $12.59.
Cosmos Price Prediction 2028
Cosmos’s prices are anticipated to remain between $18.49 and $21.97 in 2028, with an average of $19.01.
Cosmos price forecast 2029
The ATOM coin price prediction for 2029 estimates growth, with prices ranging from $26.32 to $33.07 and an average of $27.08.
Cosmos Price Prediction 2030
By 2030, Cosmos is projected to reach a maximum atom price of $45.96, an average price of $39.35, and a minimum price of $38.00
Cosmos Price Prediction 2031
By 2031, Cosmos is expected to attain a minimum price of $56.72, with an average price of $58.29. The maximum price of the coin is predicted to be $67.56.

Cosmos price prediction: Analysts’ ATOM price forecast
| Firm Name | 2025 | 2026 |
| Coincodex | $6.05 | $3.05 |
| DigitalCoinPrice | $9.37 | $10.73 |
Cryptopolitan’s Cosmos price prediction
According to Cryptopolitan’s price prediction for Cosmos (ATOM) in 2025, the cryptocurrency is projected to exhibit a price range from a potential low of $5.55 to a high of $6.22.
Cosmos historic price sentiment

- Cosmos, created by Ethan Buchman and Jae Kwon, launched its Initial Coin Offering (ICO) in 2017, with the network officially going live two years later in 2019.
- During the bullish market cycle of 2021, Cosmos saw its price peak at over $44, driven by significant investor interest and market optimism.
- However, following this surge, on 3rd April 2022, the price of Cosmos (ATOM) sharply declined to $6.39. Since then, Cosmos entered a prolonged phase of consolidation, trading within a range between $6.39 and $16 as market dynamics fluctuated.
- In early 2024, particularly around 8th March, Cosmos encountered significant resistance at the $13 level, struggling to gain momentum above this point. This resistance reflected broader market sentiment and potential selling pressure.
- By July 2024, ATOM’s price was trading in a narrower range, between $5 and $6, indicating a lack of upward momentum.
- By August 2024, the price had further dipped to $4.02, suggesting increasing bearish pressure. This recent decline highlights ongoing challenges for Cosmos in maintaining its price stability and suggests potential further downside as market bears dominate, putting pressure on potential buyers to defend against a continued downward trend.
- On September 2024, the Cosmos price ranged between $4 to $5, and on October 06, the price traded at $4.5837 with a trading volume of $48.48M.
- On November 5, ATOM was trading at $4.10. By December 5, ATOM’s price surged significantly, trading at $10.
- Cosmos ATOM surged to $9 at the start of December 2024, but it declined to $9.6 and closed the year at $6.3.
- In January 2025, Cosmos peaked at $7.77, and in February, it’s trading between $4.54 and $4.86.
- ATOM value decreased further in March as it dipped to the $4.0 to $4.2 range.