
Reason to trust
Strict editorial policy that focuses on accuracy, relevance, and impartiality
Created by industry experts and meticulously reviewed
The highest standards in reporting and publishing
Strict editorial policy that focuses on accuracy, relevance, and impartiality
Morbi pretium leo et nisl aliquam mollis. Quisque arcu lorem, ultricies quis pellentesque nec, ullamcorper eu odio.
Independent market technician EGRAG CRYPTO posted an updated weekly XRP/USD chart on X. The visual, built on Bitfinex data, frames the entire post-July 2024 advance by XRP as the flag-pole of a classic bull-flag continuation pattern and argues that the subsequent ten-week drift has traced out a near-textbook, downward-slanted consolidation channel whose upper and lower rails are highlighted in magenta.
XRP Poised For Breakout
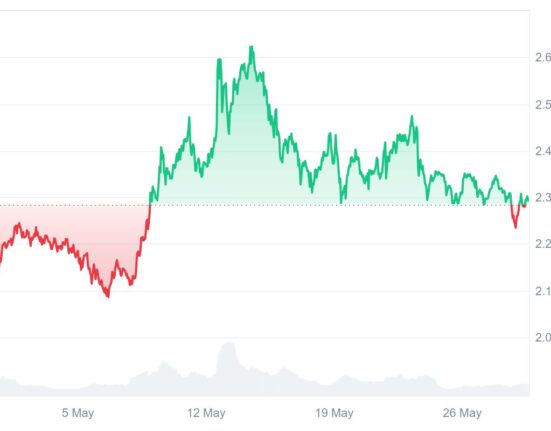
“The success rate of breaking upwards is around 67–70 percent,” the analyst writes, citing bulk pattern-recognition studies that underpin the set-up’s statistical edge. XRP is trading near $2.30, a value marked on the chart by a blue dotted horizontal line intersecting the body of the flag.
Related Reading
Beneath that, a white line at $1.50 records the late-2024 breakout shelf that now functions as first higher-time-frame support, while a deeper red horizontal at roughly $0.60 flags the base from which the current cycle began. Threading up through the entire structure is a rising yellow moving average—visually consistent with the 20-week EMA (currently at $2.21)—underscoring what Egrag calls the market’s “still-positive long-term trend bias.”

From that foundation the technician derives three measured-move objectives. “For long-term breakouts I prefer logarithmic charts, especially in crypto, because of its exponential growth over short periods,” he explained. On that basis a log-scale projection extrapolates the full height of the flag-pole and lands at $18.00. A linear projection, which treats each dollar of advance equally, prints a markedly lower $5.50. Taking what he describes as a “liquidity-adjusted average — my preferred method for crypto targets,” Egrag settles on $11.75.
Related Reading
Because digital-asset order books remain relatively thin, the analyst overlays a variability band of fifteen to twenty percent, stretching the log target to roughly $20.70–$21.60, the average to $13.51–$14.10 and the linear to $6.33–$6.60. “I usually apply a 15–20 percent variability because crypto liquidity is still smaller compared to legacy markets, so targets can extend both ways,” he cautioned.
A disclaimer printed directly on the graphic reiterates that the numbers and targets are “for simulation purposes only and not financial advice.” Even so, the roadmap is clear for Egrag: so long as XRP defends the mid-flag zone near $2.30 and, critically, the structural pivot at $1.50, the technician contends that an eventual breakout could vault the token into double-digit territory, with the headline log objective sitting just beneath the psychologically resonant $20 handle.
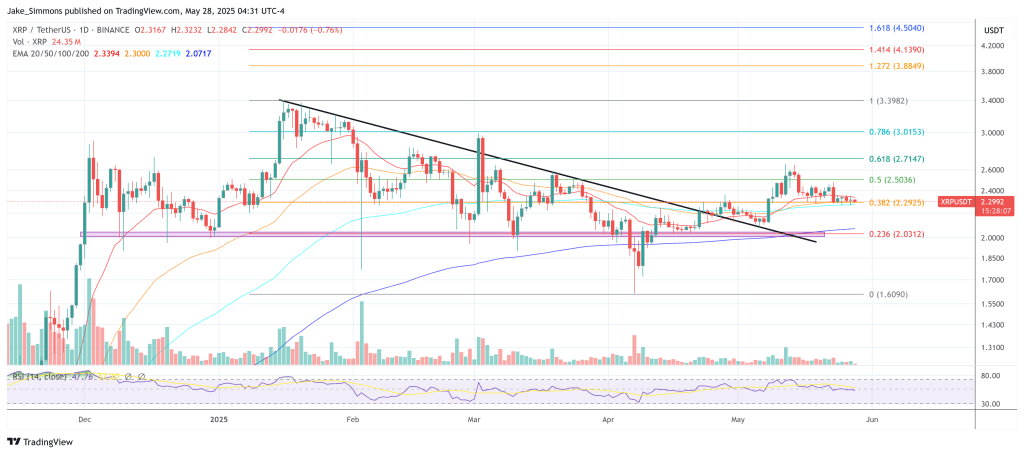
At press time, XRP traded at $2.28, still hovering just below the upper trendline of the bull flag. A close above the resistance could accelerate the XRP price quickly towards the 0.5 and 0.618 Fibonacci retracement levels at $2.50 and $2.71 respectively.
Featured image created with DALL.E, chart from TradingView.com